Today was the second of the
CGT Summer Time Trials paddle races in the Imperial River. For this one I used one of the shop's demo boards: a
14' x 27" 404 v3 raceboard in PVC construction. The board is 2.25" wider than my own board (Fanatic Falcon), making it a lot more stable and a wee bit harder to maintain at top speed. My time was 47:54, second place after Mark Athanacio who got 46:34. Both Mark and I were slower than we were in the first race, probably because we weren't drafting each other like we did that time. Also it was really hot- 31C already when the race started.
This was the first race where I used the NK SpeedCoach SUP 2 and heartrate monitor during the race. Over the last week I've been fidding with the SpeedCoach a lot and figuring out how to do some more stuff with it. There are two formats that the device can export data in: .csv and .fit. The former file type is a data table that can be opened in Microsoft Excel and used to make graphs, etc. The latter includes latitude/longitude coordinates and can draw your path in a mapping program. It's not entirely straightforward to draw your path, though. Here's how I've done it so far.
1. From the "
NK Link" program that goes with the SpeedCoach, you export the data as a .fit file.
2. You upload the file to an
online fit to tcx converter and download the .tcx file.
3. You use the website "
GPS Visualizer" to generate a Google Earth format (.kml) file from the .tcx file. GPS Visualizer gives you lots of options for the conversion. I picked "colorize by speed" to show different rainbow colors to my track depending on how fast I was going. I'm not satisfied with that feature, though, because the colors aren't a smooth blend. My track just looks like a birthday confetti of colors and there's no easily readable key to what color is what speed.
4. You download the .kml file produced by GPS Visualizer and open it in Google Earth. Then you can get whatever zoom and angle you want to view your track.
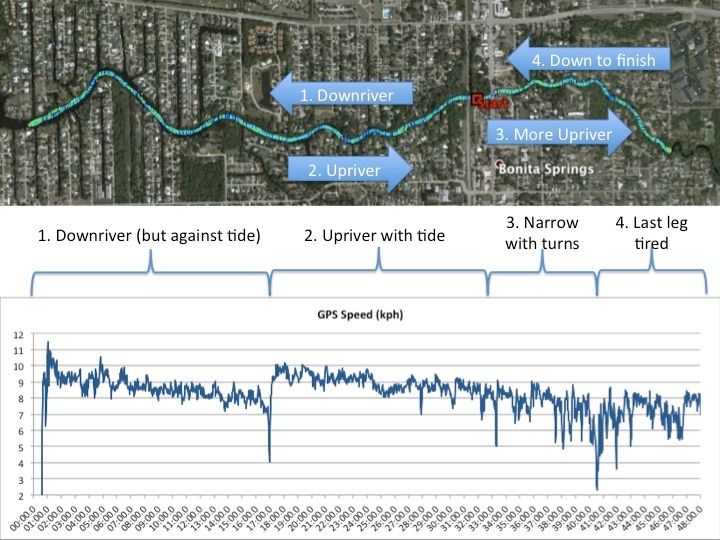
I've combined the GPS track and some of the data from the race into the graphics below. Getting the axes to look right in the Y versus elapsed time graphs was tricky. I had to tell Excel to use 0.000694444 (which is [1/24]/60) as the major unit on the x axis so that the numbers would go minute by minute instead of in weird decimals. Also, you need to make the graphs as scatterplots, then choose "no markers" for the markers and add a connecting line. If you try to make a line graph directly it doesn't work as well. Anyway, here are the pictures and some story to go with them:
The course starts at the dock at Riverside Park in Bonita Springs, and goes East, downriver, towards the Gulf of Mexico. The river is tidally influenced so sometimes, like this morning, the water actually flows upriver. So we were paddling against the current a bit on the first leg. You can tell that going upriver was favored because of the boost of speed I get at 17 minutes, which is right after I turn around the downriver buoy and start coming upriver with the tide. The next part of the race I mostly get slower and slower, which is probably due to a combination of fatigue, my technique slipping, less favorable current, and the upriver section being narrower with more bends.
Looking at the heart rate graph you can see some neat patterns that don't show up in just the speed alone. One is that after the strain of the initial 90 seconds of sprinting, my bpm actually declines for a few minutes. That's because I'm drafting behind Brandon Gunderson's
Hobie Apex 4R 14-5.75. I didn't have to paddle as often or as hard to maintain my speed then as I when I wasn't drafting. I passed Brandon after 5 minutes and he drafted me off and on until the buoy turn at 17 minutes when I lost him. Even though I was a little faster, it might have been a good strategic move to keep Brandon along and have him lead for a while so I could rest. My heart rate got really high going hard upriver in the blazing heat, sometimes getting above my age-based maximum safe heart rate recommendation of 184 bpm. At 25 minutes I could feel my heart skip a beat and thud in an uncomfortable way. That happens to me occasionally when I'm in the middle of a long hard stretch, but this is the first time I got to capture it on the heart rate monitor. I eased off the throttle to recover back down to 170ish bpm, and tried to keep below 184 until the very end of the race. It's interesting that my speed was getting slower and less consistent in the last 25% of the race even though my effort (heart rate) was steadily high. That might have something to do with my technique slipping. When fitness trainer Mark Athanacio (who had started about a minute behind me) passed me on the way to the upriver buoy he reminded me to straighten up and recover a bit between strokes to get a better breath and to be able to load more weight onto the next stroke.
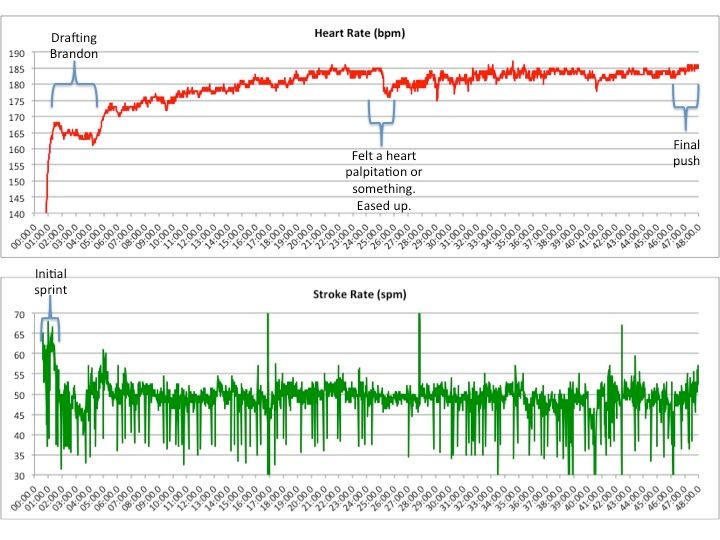
I find that stroke rate is the hardest thing to interpret from the SpeedCoach data. For one thing there are always some spikes of weirdly high or low stroke rates. Low stroke rate might happen when switching sides paddling, and apparently high stroke rate might be the result of the sensor getting bumped or jostled by stepping around on the board or rocking in the waves. Despite the blips, there does seem to be a trend of high stroke rate being associated with faster speed. I think one of my instincts when I get tired is to take slower but deeper strokes. However, in terms of speed gained vs. energy spent, it might be better if I can train myself to keep a relatively fast tempo when I'm tired but reduce the power a little to not get exhausted.
Although this post has been almost all about me, I should make sure to congratulate everyone who raced today. It was a tough, hot day, and lots of people still trucked through the whole course, many of them without the benefit of fancy raceboards and weed-shedding fins like I had. I saw more than one birds' nest of pine needles and sticks shake loose from finishers' fins when they finally stopped paddling at the finish line. I'd say weed fins are essential for freshwater paddling in Florida even for non racers.